Undergraduate Capstone
Completed for the GIS Certificate | UW Tacoma
In urban neighborhoods, it is common for students to walk to school as well as to visit parks and friends. In such neighborhoods, pedestrian safety is vital. My project is an outgrowth of the Action Mapping Project (AMP) currently underway in Tacoma. AMP's primary goal is to bring the world of GIS to public school children. We are amplifying the voices of young people and giving them a tool to convey their perceptions of their neighborhood. As researchers, we are gathering information about how they use their space while giving them a head start in their pursuit of higher education.
My project had three objectives. First, I wanted to fully incorporate participatory mapping into a project that is aimed for people. Too often maps are about people, seldom for them, and hardly ever created with them. Second, I wanted to develop a methodology to address pedestrian safety that could be replicated for additional factors later. Finally, I wanted to focus as much as possible on youth because their fears are not necessarily the same as their parents and other adults in the community.
Qualitative Methods
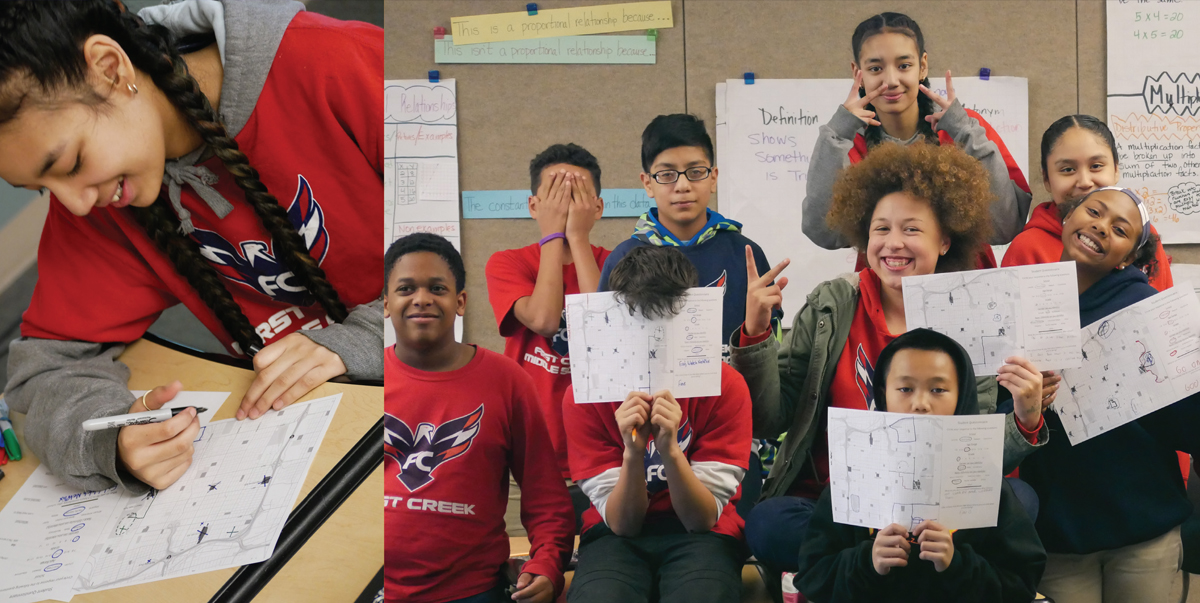
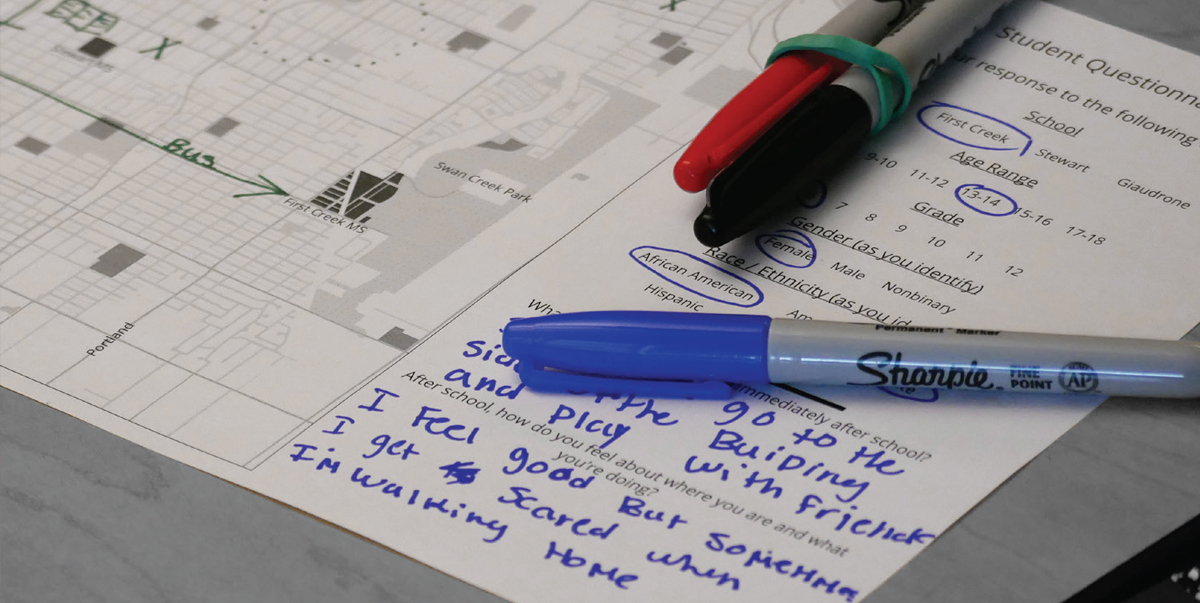
Student participation is a key element of this project. During the AMP pilot student, students were provided a street map of the area and asked questions about where they go and what routes they take when walking. This formed the qualitative data set for my project. Besides drawing maps, students were asked open ended questions to elicit comments. One girl’s comment about being fearful walking home succinctly shows the barriers some students face every day. Going to school is not optional, and students have a right to feel comfortable when they move about their neighborhood.
Quantitative Methods
First, I selected five factors with which to create a walkability index: sidewalks, street lights, stop signs, stop lights, and pedestrian-auto collisions. Early on, I found that sidewalk data did not exist, so I had to create it. I did this by opening my streets attribute in ArcMap and adding a new field for sidewalks. Zooming in on each street segment in the ESRI base map and streets layer, I looked for sidewalks. This allowed me to populate my new field and export the result to create its own shapefile. I then calculated and normalized the density rates for each factor using population or street length as applicable. After calculating Z values, factors in each block were assigned a classification of low (1), average (2), or high (3). By summing the scores for each factor in a given block, a total walkability score emerged for that census block.
Results
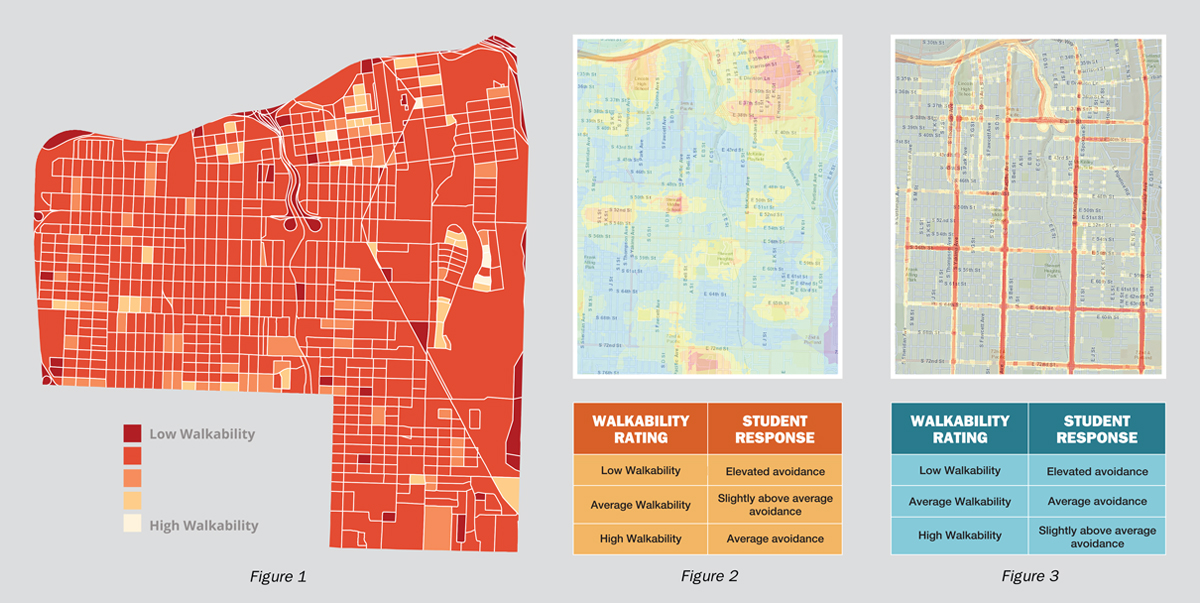
Examining these summations, I already saw that walkability was going to be mostly uniform over the entire area. Figure 1 visualizes the results spatially. In general, each census block has some feature that reduced its total score. There are no areas that could be considered completely safe for pedestrians based on my index. Missing traffic-calming measures and sidewalks were the factors most needed of improvement. The results comparing the quantitative data with the area and routes that students preferred aligned well. The same cannot be said for areas and routes they avoided. Figures 2 and 3 place qualitative and quantitative results side by side. We would expect areas with low walkability scores would be avoided more often than those with high walkability scores. Conversely, areas with high walkability scores should be avoided less frequently, both in terms of routes and areas. This is essentially what we see in the “areas avoided” data. The most walkable areas are also the least avoided. However, the route data is contradictory. In areas that are most walkable, we still see elevated levels of avoidance. This could represent actual avoidance or preferred avoidance, meaning students must use the route even if they would prefer another way.
Area of Interest
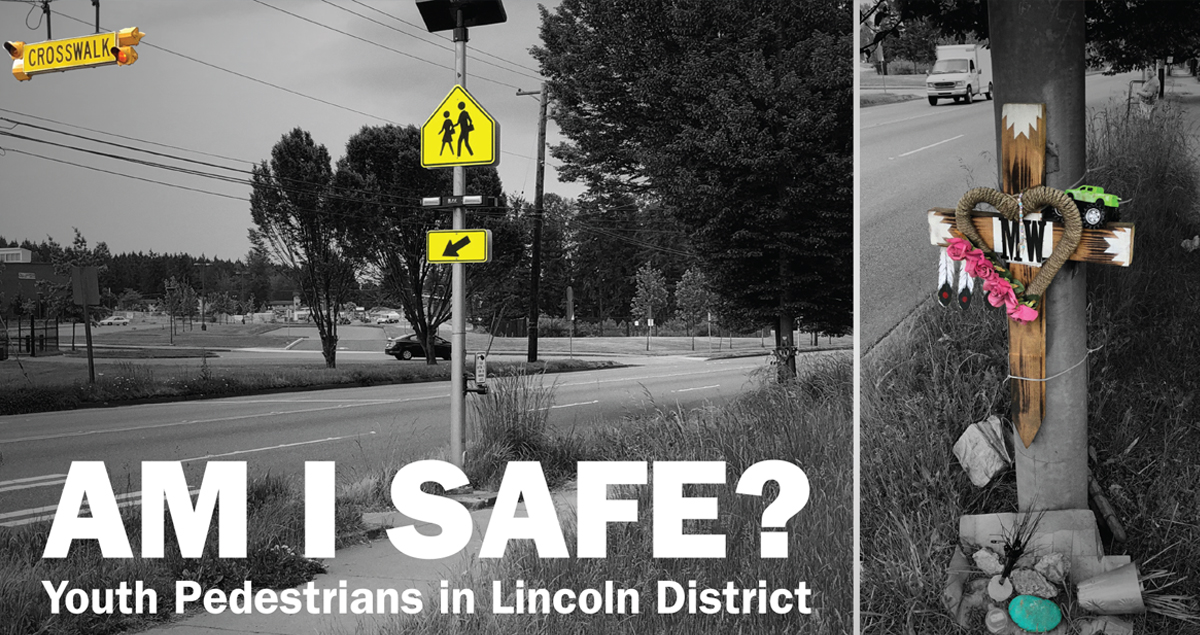
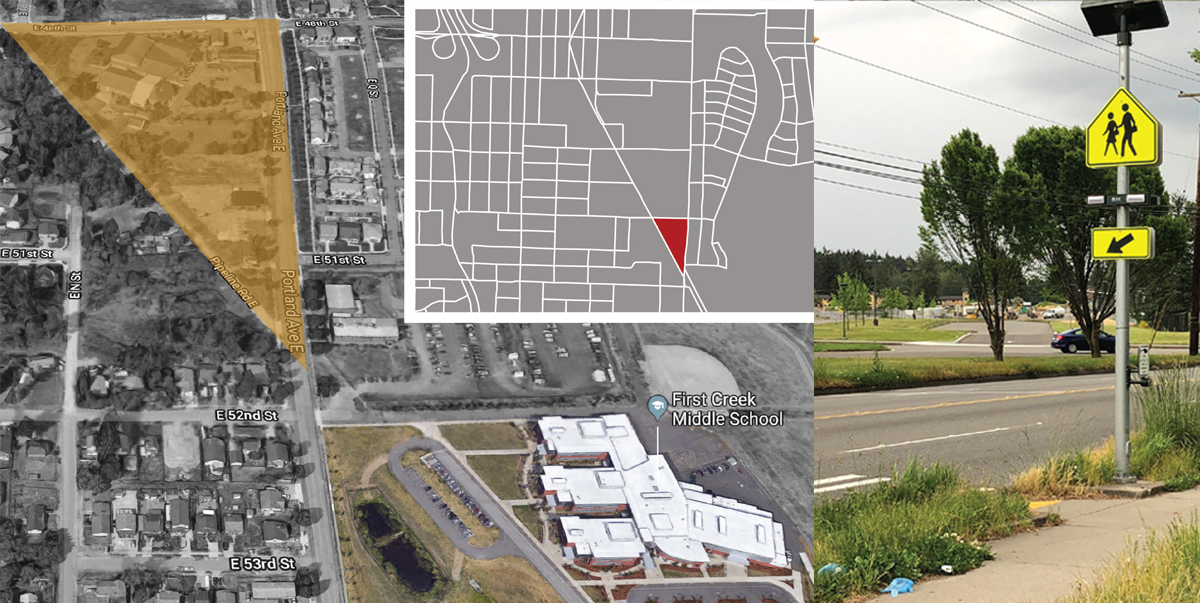
One census block stood out because it received one of the lowest walkability scores of out of the 815 census blocks. Looking more closely at the z scores, accidents at or near the intersection of Portland Avenue and Pipeline Road was the primary driver. Portland Avenue is a primary arterial where cars can be expected to be traveling at high speeds. It also happens to be very near the First Creek Middle School. Regardless of the rankings of census blocks surrounding this one its proximity to where middle school children would most definitely need to walk is enough to make it the only place where a traffic change is recommended immediately. Upon visiting the site, I found sidewalks and a crosswalk beacon in front of the school which I had not expected. Even then, when I attempted to use the crosswalk on a Sunday afternoon, I nearly got hit by multiple speeding cars. I also found a cross nearby in memory of a deceased child. Clearly, a stop light versus a blinking one is in order and would better serve neighborhood youth.
Conclusion
From a planner’s perspective, it is useful to know that walkability alone is not a determinant of youth activity. Other considerations are needed to make the routes more youth-friendly. AMP follow-up meetings should be able to offer clarifying input. One obvious difficulty with the results is there is no standard walkability reference with which to compare the subject area. Given the socioeconomic character of this part of Tacoma, other research indicates the Lincoln catchment is likely to be low for walkability in general if we were to compare it with the other urban school catchment areas. Thus, it was no surprise that the difference between low, average, and high walkability is small in this case. The AMP dataset is a new addition to a traditional walkability analysis. How it confirms or confounds what we believe about how people use their urban space is important. A study that involves all high school catchment areas across the city is certainly desirable. Similarly, understanding how large portions of the Lincoln catchment area are avoided, yet the streets that surely must run at least partially through them are not, requires more study. Students may want to avoid areas, but still must traverse them to get to school or other destinations.